Persistence, Graduation, and Employment Rates
Persistence and Graduation Rates
| Outcome | Included Cohorts * | Total Students | Completed Outcome - Count | Completed Outcome - Percent |
|---|---|---|---|---|
| Persisted Fall to Spring | Through 2024-25 | 157 | 156 | 99.0% |
| Persisted Fall to Fall | Through 2024-25 | 157 | 155 | 99.0% |
| Graduated in Two Years | Through 2023-24 | 135 | 128 | 95.0% |
| Graduated in Three Years | Through 2022-23 | 112 | 108 | 96.0% |
* All analyses consist of enrolled biomanufacturing students beginning with the first cohort (2017-18) and ending with the listed academic year. Cohorts were excluded to allow time for the outcome completion.
Employment Rate
| Outcome | Percent Employed |
|---|---|
| Alumni | |
| Through Graduating Class of 2025 | 88.0% |
| Current Students | |
| Graduating Class of 2026 | 55.0% |
| Graduating Class of 2027 | 24.0% |
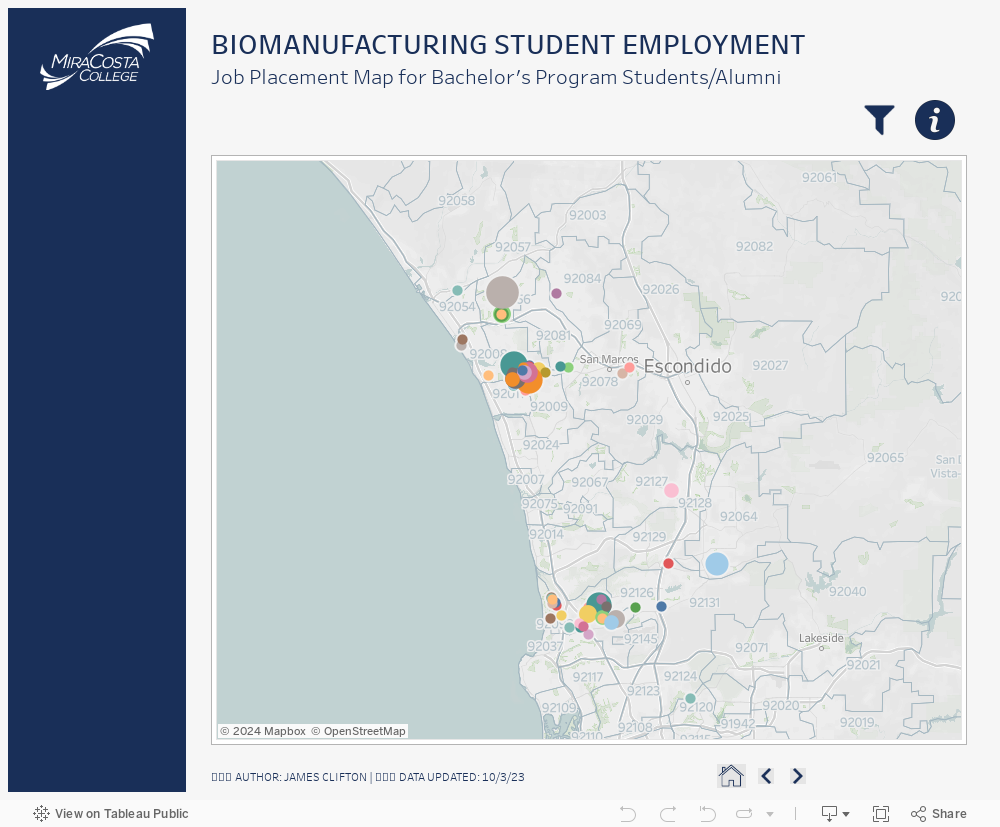
Biomanufacturing Student Employment Job Placement Map for Bachelor's Program
Student Profile: Program Acceptance and Graduation
Age
| Age | Enrolled Students | Graduates |
|---|---|---|
| 20 and Under | 13.4% | 16.2% |
| 21 to 24 | 26% | 24.3% |
| 25 to 29 | 25% | 25.7% |
| 30 to 39 | 24% | 25% |
| 40 and Older | 11.5% | 8.8% |
Gender
| Gender | Enrolled Students | Graduates |
|---|---|---|
| Female | 52.9% | 57.4% |
| Male | 45.2% | 41.9% |
| Nonbinary | 0.0% | 0.0% |
| Other/Unknown | 1.9% | 0.7% |
Ethnicity
| Ethnicity | Enrolled Students | Graduates |
|---|---|---|
| American Indian / Alaska Native | 0.5% | 0.0% |
| Asian | 8.2% | 6.1% |
| Black / African-American | 1.9% | 1.4% |
| Hispanic / Latinx | 36.5% | 38.5% |
| Middle Eastern/ North African | 0.5% | 0.0% |
| Pacific Islander | 1.0% | 0.7% |
| Two or more races | 10.1% | 12.2% |
| White | 38.0% | 37.2% |
| Unknown | 0.0% | 0.0% |
Other Student Characteristics
| Characteristic | Enrolled Students | Graduates |
|---|---|---|
| First Generation | 26.4% | 25.0% |
| Economically Disadvantaged | 69.2% | 70.3% |
| SAS Student | 11.5% | 12.8% |
| Veteran | 6.7% | 1.7% |
| Military Dependent | 9.1% | 7.4% |
| Food Insecure | 23.6% | 20.9% |
| Housing Insecure | 21.2% | 16.9% |
Acceptance and Enrollment Rates
| Outcome | Total Students | Completed Outcome-Count | Completed Outcome-Percent |
|---|---|---|---|
| Applied | 290 | 290 | 100.0% |
| Accepted | 242 | 202 | 83.4% |
| Enrolled | 208 | 149 | 71.4% |
* These analyses include all applicants or students beginning wih the first cohort in 2017-18 up to the most recent cohort in 2025-26.